Puerto Rico Wave Climate Atlas: Map Products
The figures below (click on thumbnail for high-resolution version)
show maps of different statistical quantities that characterize
Puerto Rico’s wave climate:
-
A map of the mean simulated significant wave height (in feet)
from January 1 1979 – December 31 2018. -
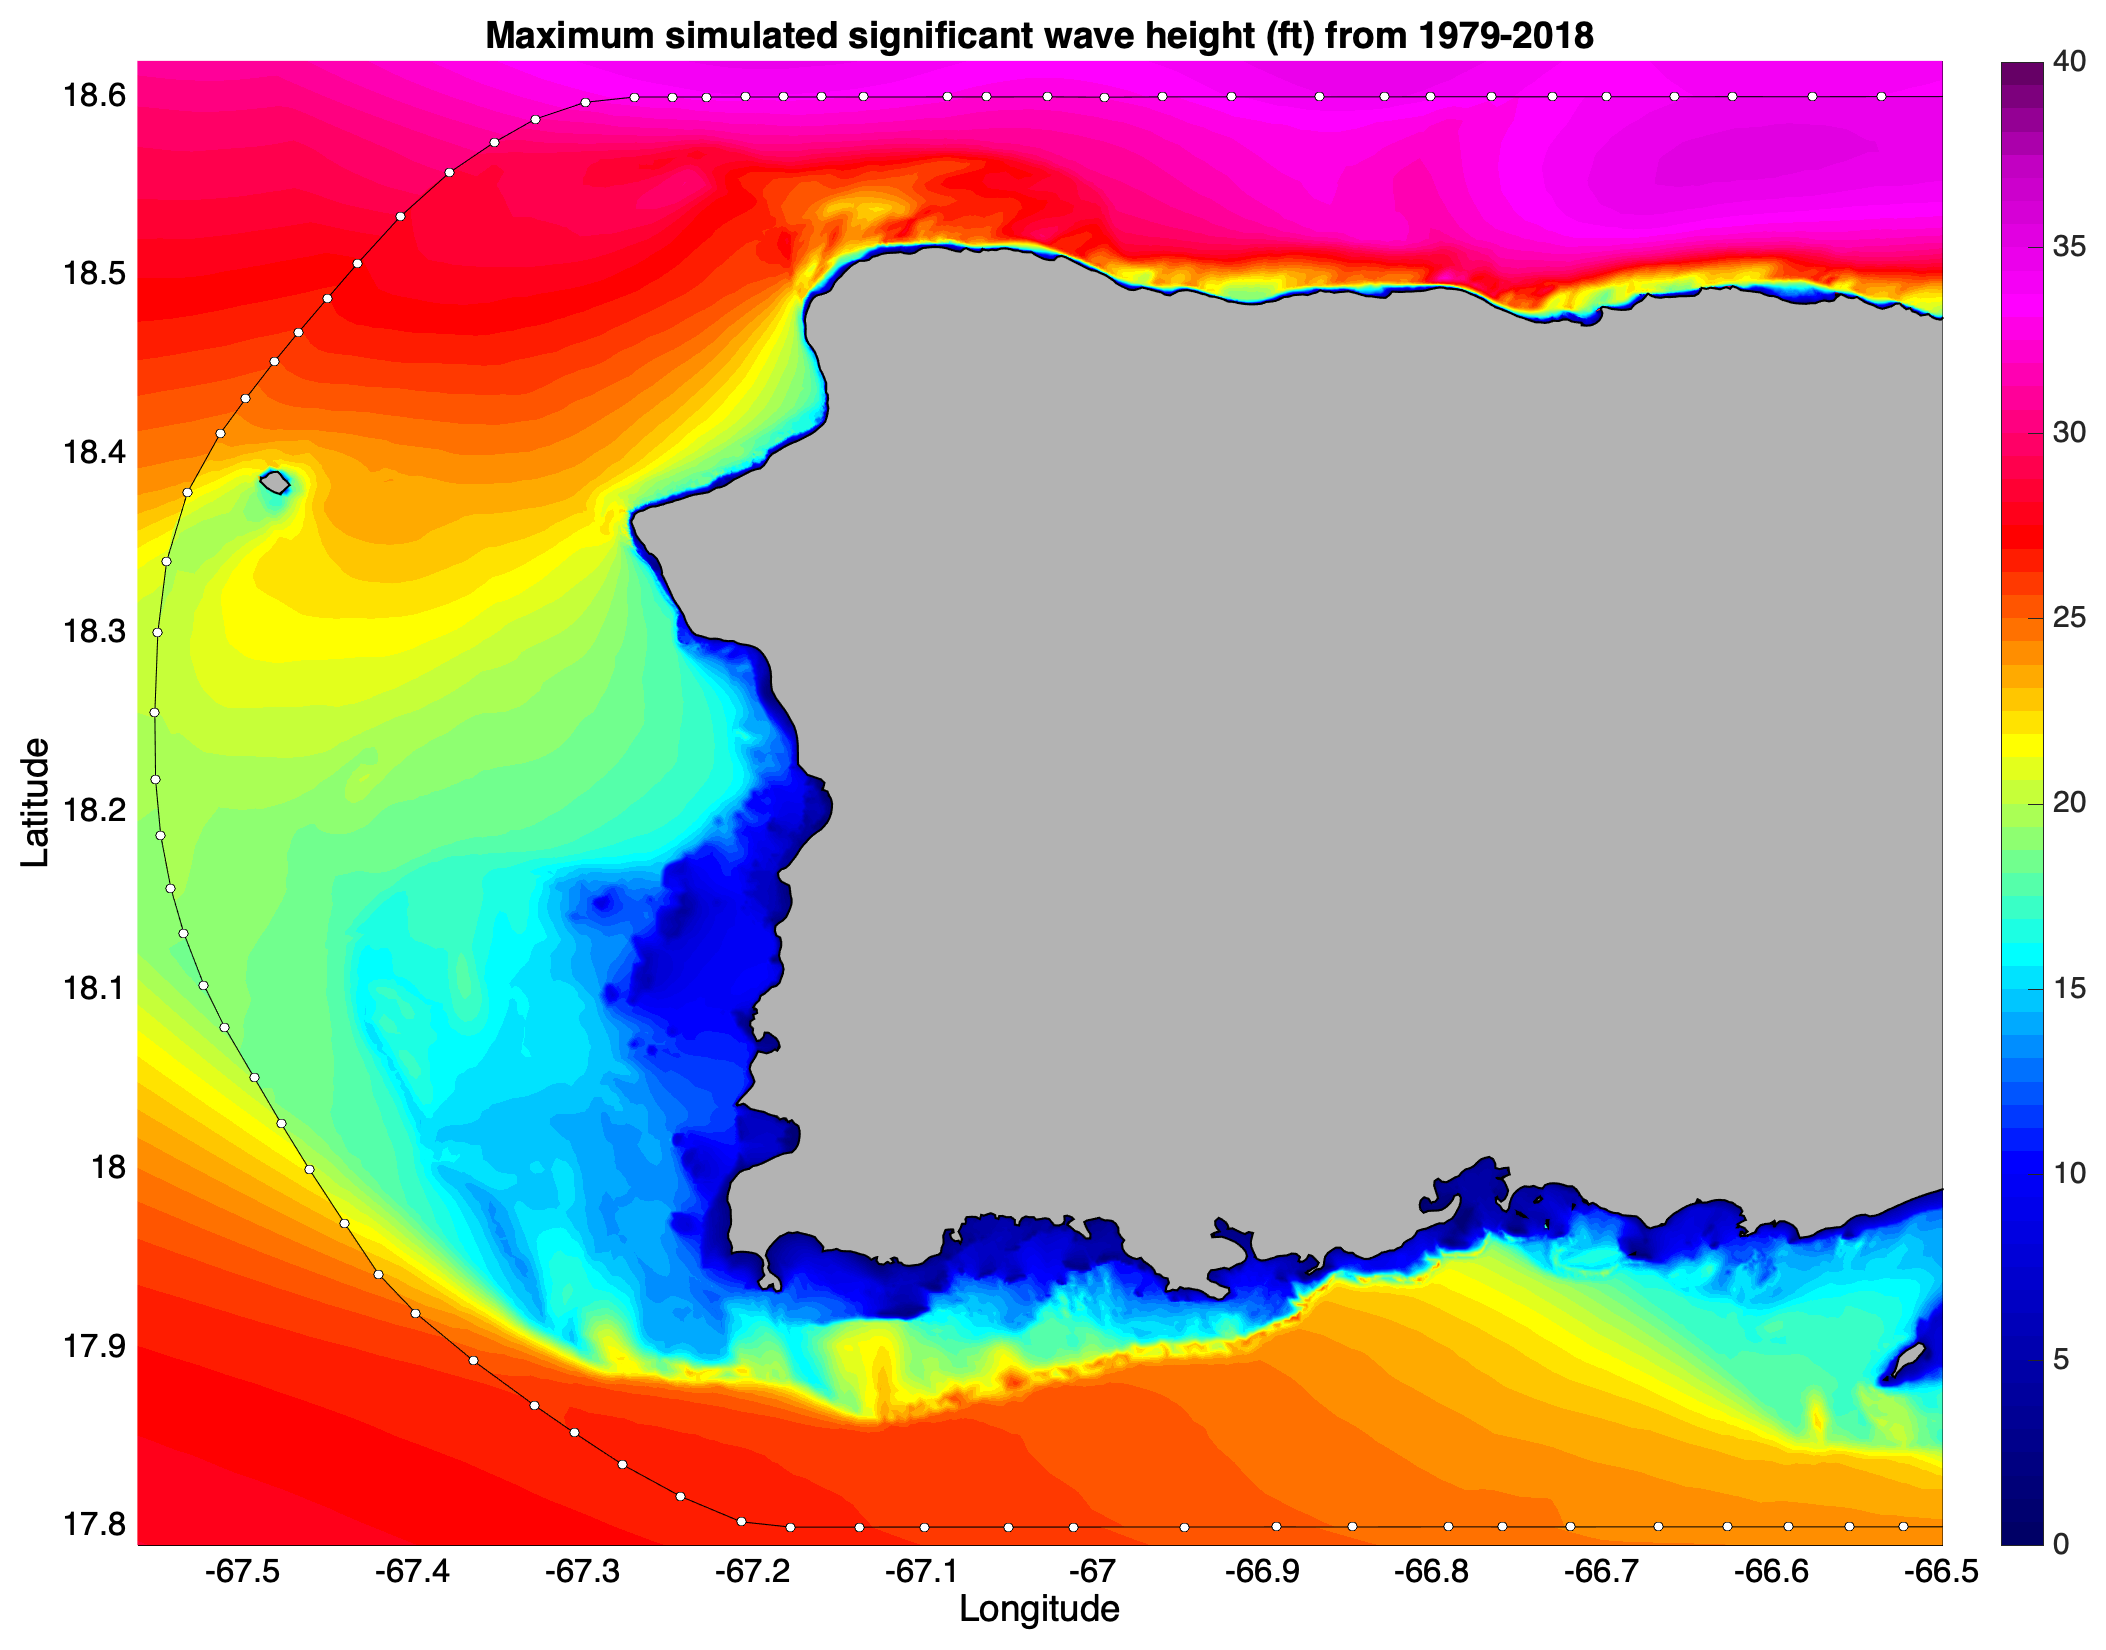
A map of the maximum simulated significant wave height (in
feet) from January 1 1979 – December 31 2018. -
A map of the mean simulated omnidirectional wave power
(measured in kilowatts per meter of wave crest kW/m) from
January 1 1979 – December 31 2018. -
A map of the maximum simulated omnidirectional wave power
(measured in kilowatts per meter of wave crest kW/m) from
January 1 1979 – December 31 2018. -
A map of the relative risk ratio RR = Max/Hmean (Neary et al., 2020</a >). This quantity represents the ratio of the maximum 40-year
simulated wave height at a specific location compared to the
mean wave height.
Figures for the full PR/USVI region and for three subregions
(Western PR, Eastern PR and USVI – except St. Croix) are provided
here. For custom products or for maps of specific regions please
contact the Principal Investigator Miguel F Canals Silander via
email: miguelf.canals@upr.edu.
MAP PRODUCTS FOR PUERTO RICO / USVI REGION


MAP PRODUCTS FOR WESTERN PUERTO RICO


MAP PRODUCTS FOR EASTERN PUERTO RICO


MAP PRODUCTS FOR USVI / BVI (EXCEPT ST. CROIX)


